I use my own software, Epigrass, to run my geo-referenced dynamic populational models. Epigrass is great for running complex models but so far, it didn't help much when it came to representing the results in a nice way.
I then decided to give Epigrass a major overhaul (which I hope to release soon) to include support to shapefiles (.shp). Shapefile is a very common map format supported by every GIS software I know. Thankfully, there is a great library for handling this type of files (and others too) which has bindings for Python. Its called OGR and is distributed as part of another library called GDAL (apt-get install python-gdal). The following code is taken straight from Epigrass-devel CVS tree (module epigdal.py) on sourceforge, so feel free to explore the rest of the code if you fell like.
So, the OGR does the loading of vector maps (and any data associated with it) and make them available for manipulation in Python.
import ogrThe code above takes care of extracting the first layer from "mymap.shp". A layer is a set of geometrical objects (points, lines or polygons), called Features. A Shapefile may contain many layers, if you want to find out about them, you can write something like this:
map = ogr.Open('mymap.shp')
layer = map.GetLayer(0)
nlay = map.GetLayerCount()
layer_list = [map.GetLayer(i) for i in xrange(nlay)]
Or you might want to get the layer names:
layer_namelist = [map.GetLayer(i).GetName() for i in xrange(nlay)]
Fortunately my map had a single layer, so I just proceeded to get a hold of the features in the layers. In my case, I was only interested in Polygons, to calculate their centroids (geometric center). At this point, I will have to refer the reader to a link to the code since Blogger won't allow you to edit decently formatted code. So for the feature extraction code, look at lines 71-93 of this module.
In that code, I iterate over the layer's features, and get the centroids from their geometries and save both the centroids and the geometry objects in dictionaries using the variable 'geocode' from the map's own database as key. Note the I do this only for type 3 geometries (polygons).
My next step is then to generate another map layer with centroid data included. This time it will be a layer of points instead of polygons. See how I do that in lines 96-138.
Now we have covered how to read a layer an how to create a layer. We have the necessary skills to move on to the main topic of this post, which is creating a layer in Google Maps/Earth from a layer derived from a shapefile, plus whatever data we may want to associate with it. Google use its own XML schema to represent GIS layers. It is called KML. I am not going to explain KML in detail here, try this tutorial or the Google documentation. I am going to create the KML directly using minidom from Python's standard library. Also, I am going to encapsulate the code into a class to better organize it. Look at class KMLGenerator which starts at line 259. To use this class you just call the method addNodes (passing a layer object taken from a shapefile as shown above, after instantiating the class, and then call writeToFile to write your KML file.
As I create the polygons, I color them according to the values of one of the data fields of the layer. I use matplotlib cm class and rbg2hex function, tho choose the color and convert it to hex format.
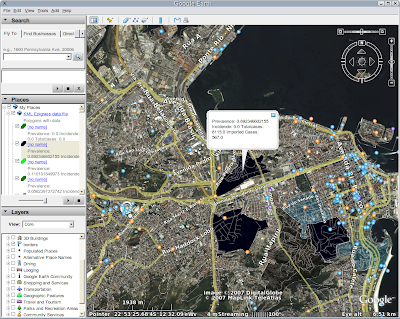
to finish it off, the required screenshot:

Notice the polygons colored according to disease prevalence, and the comment which shows up in the pop-up balloon.
I hope you enjoyed reading this post. Please post a comment if you have any further quastions or comments.
3 comments:
Awesome! I've been looking for a way to do this.
That looks realy helpful, its exactly what I am trying to do. Thanks. I'm going to have to get a friend with some comp sci experience to help me though since I am a bit of a newbie. Cheers.
~Michael
Interesting post.
Post a Comment